
An observability dashboard turns raw mainframe data into views that people outside the systems team can read. It opens on a summary of the whole IT system, and from there each reader clicks down to the level of detail they need.
Zetaly was founded on a gap seen at every customer site. The systems programmers understood every figure on their technical dashboards, built on SMF (System Management Facilities) records, but their managers could not read them. The data existed, yet most people who needed it couldn’t use it.
Zetaly’s observability offering closes that gap with two products. Zetaly Data Platform (ZDP) prepares the data, and Zetaly Service Intelligence (ZSI) shows a readable summary first, with the technical detail one click away.
Monitoring dashboard or observability dashboard
An IT monitoring dashboard displays raw metrics as it captures them, straight from the SMF records, over a short window of 10 minutes to one hour at most. When a light turns red, the operator must already know which other screen holds the cause. Experienced systems programmers manage with these screens, because they read raw SMF values fluently. New systems engineers lack that fluency because they have neither the knowledge senior staff built over decades nor deep expertise in every subsystem.
An observability dashboard starts from prepared data instead. Before any record reaches the screen, the platform enriches and transforms it to make it easier to interpret. A business intelligence (BI) tool then displays the result with zoom and drill-down. The entry view covers the whole IT system at a high level. If every indicator is green, the operator moves on. If one turns red, each click opens a more detailed dashboard, level by level, down to the data that turned the light red. The operator does not need to know in advance which screen holds the cause, because the dashboard leads there.
History adds a second difference, because a monitoring screen keeps too little of it to compare today with the past. Take a bank whose busiest time of the week is Tuesday morning, and which uses past Tuesdays as the reference for its consumption curve. When this Tuesday’s curve moves away from earlier Tuesdays at the same hour, the dashboard flags the gap as an anomaly. ZSI detects these anomalies automatically or against criteria that the customer defines.
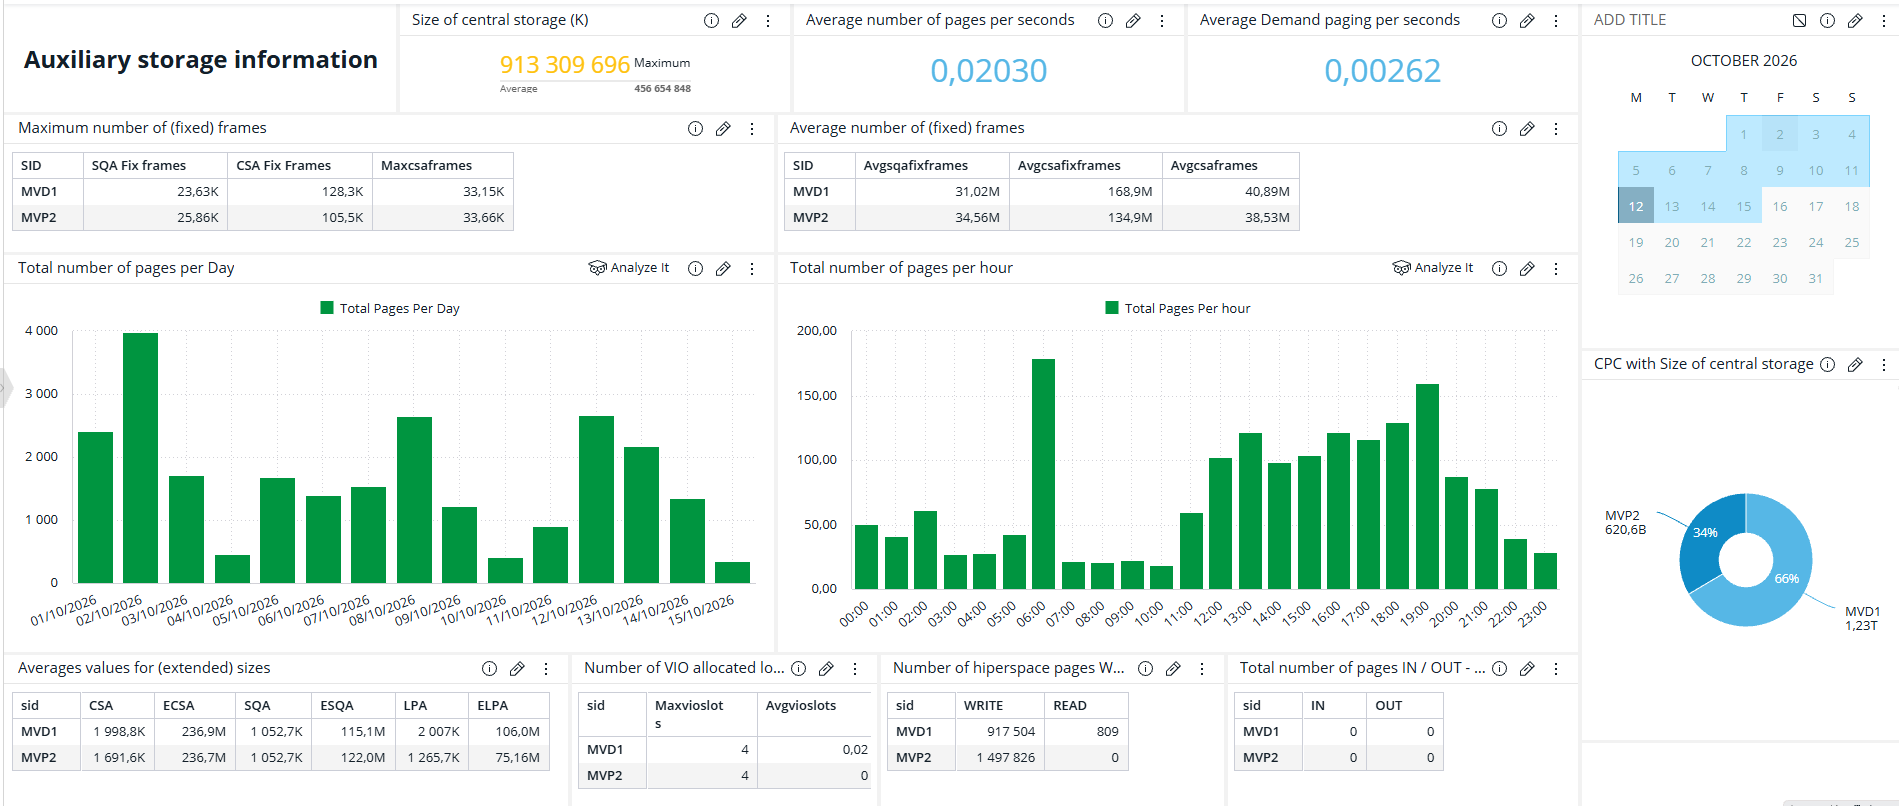
The deepest levels stay technical, however. At the bottom of the drill-down, the data is mainframe data, and it still takes a systems programmer to read it. The screen below shows one of these levels, auxiliary storage, which is the disk space that z/OS uses for paging, with figures by day and by hour for two systems. A manager needs a different view, built around the questions that a manager asks.
Source: Zetaly Service Intelligence (ZSI), screen from a customer environment.
Business observability: one number, four readers
For a long time, managers had no view of their own. Only a few specialists could read raw mainframe figures, so those specialists had the last word on decisions about capacity and cost.
Mainframe consumption shows the problem. Technical dashboards report it in MSU (million service units), and four people read the same MSU figure for four different reasons.
The systems programmer reads MSU as a sign of performance, because good service levels show in the MSU figures. The mainframe manager reads the same figure as a cost risk, because IBM prices software such as Db2 on MSU (BMC). The capacity planner uses it to ask for more capacity. The chief financial officer (CFO), who pays the IBM bill, wants a simpler answer, such as how many MSU Db2 cost last month. With that answer, the CFO can check with the departments that use the capacity whether they need more and refuse an upgrade they don’t need.
Today, when every reader sees the figure in terms they understand, every role has facts to argue with. Zetaly calls this shared view business observability.
Business observability shows mainframe consumption by business entity, such as an application or a department, instead of by technical component. Zetaly uses the term to set its dashboards apart from tools that enrich mainframe data but still show it in technical units, such as MSU or gigabytes per second. The idea itself is wider. IBM defines business observability as visibility into data flows, business analytics, and key performance indicators (KPIs), combining technical signals with business metrics such as revenue and customer experience (IBM). Dynatrace describes the same link between technical performance and business outcomes (Dynatrace).
On the mainframe, the business metric that matters most is consumption. Since every processor consumes capacity to run the business, the useful question is not whether it consumes, but which part of the business consumes, and which part consumes more than usual.
A business view answers that question. Zetaly builds it from business categories, which each customer describes in ZDP with its own business rules. The categories can describe data centers, entities, environments, business units, business services and applications. ZSI then uses them to show consumption by segment instead of by technical component, and three examples show what this changes.
Take the manager in charge of a payment chain. A technical dashboard shows consumption by technical component, so the manager cannot tell how much capacity the chain used. In a view by business service, the manager sees what the chain used, and whether that is more than usual.
Chargeback is the second example. Billing each internal entity for the IT resources it uses needs consumption split by entity, which takes extra work when the dashboards show only technical units. When the dashboards already split consumption by entity, the invoice needs no extra work.
The third example is a group of companies. A major European bank chose Zetaly through a tender to replace several mainframe metrology tools, which measure performance and consumption over time, with one platform. That platform served several banks in the group, and each bank saw only its own data while the central team saw all of it in one place.
Customers also ask for this readability directly. One US bank already had nine tools that collected its mainframe data, but it still asked for Zetaly’s reports, because its teams could understand them and share them with everyone.
The same bank then asked for service level dashboards for its management. Each one answers a simple question, such as how long the system ran above its capacity, or how long it responded too slowly for the business to run normally. Each answer fits in one figure, such as 4 hours or 97.8 percent, and the bank’s own teams will build these dashboards after their training.
Behind the screen: how data reaches an observability dashboard
Every figure on these dashboards depends on the data behind it, which ZDP collects, transforms and enriches, stores, and exposes to the dashboards.
Collection starts with a limit set by z/OS itself. SMF data is not real-time data by nature, because z/OS decides when to write each record. ZDP therefore collects each record once z/OS has written it, without waiting for a nightly batch.
Because the volume is large, ZDP has to keep it under control. It can process up to 90,000 records per second, and it aggregates the first layer of data to the minute. It then averages the data over five minutes, one hour or one day, and builds weekly and monthly views from those averages. It also manages the life cycle of the data, from collection to deletion, so that storage does not grow without limit.
Each dashboard then refreshes at its own pace. A dashboard built on a data cube refreshes once an hour at most, while a dashboard with a live connection to the data refreshes every 30 seconds. Distance can add one more limit. One US bank uses Zetaly as SaaS (software as a service), hosted on Amazon Web Services, and because its data arrives as files every hour, its dashboards refresh every hour.
The whitepaper explains how ZDP collects mainframe logs as they are written, at about 0.2 percent of mainframe resources.
Where the dashboard stops
An observability dashboard tells the team where a problem sits, but it does not debug the application. Zetaly collects enough data to make the activity of the mainframe observable, not the line-by-line detail that debugging needs.
Observability therefore works alongside monitoring. Every Zetaly customer also runs monitoring tools, which show real-time data with little history. The team uses Zetaly to zoom in until it finds the weak point, then switches to those tools to find the exact error. To compare the tools on the market, see our guide to the best data observability tools for hybrid environments.
Getting started with observability dashboards
The first dashboards do not have to wait for a project. On a small data center, Zetaly installs the product in about a day. ZSI then comes with pre-built dashboards that cover the common needs of an information system and fill with data as soon as collection starts.
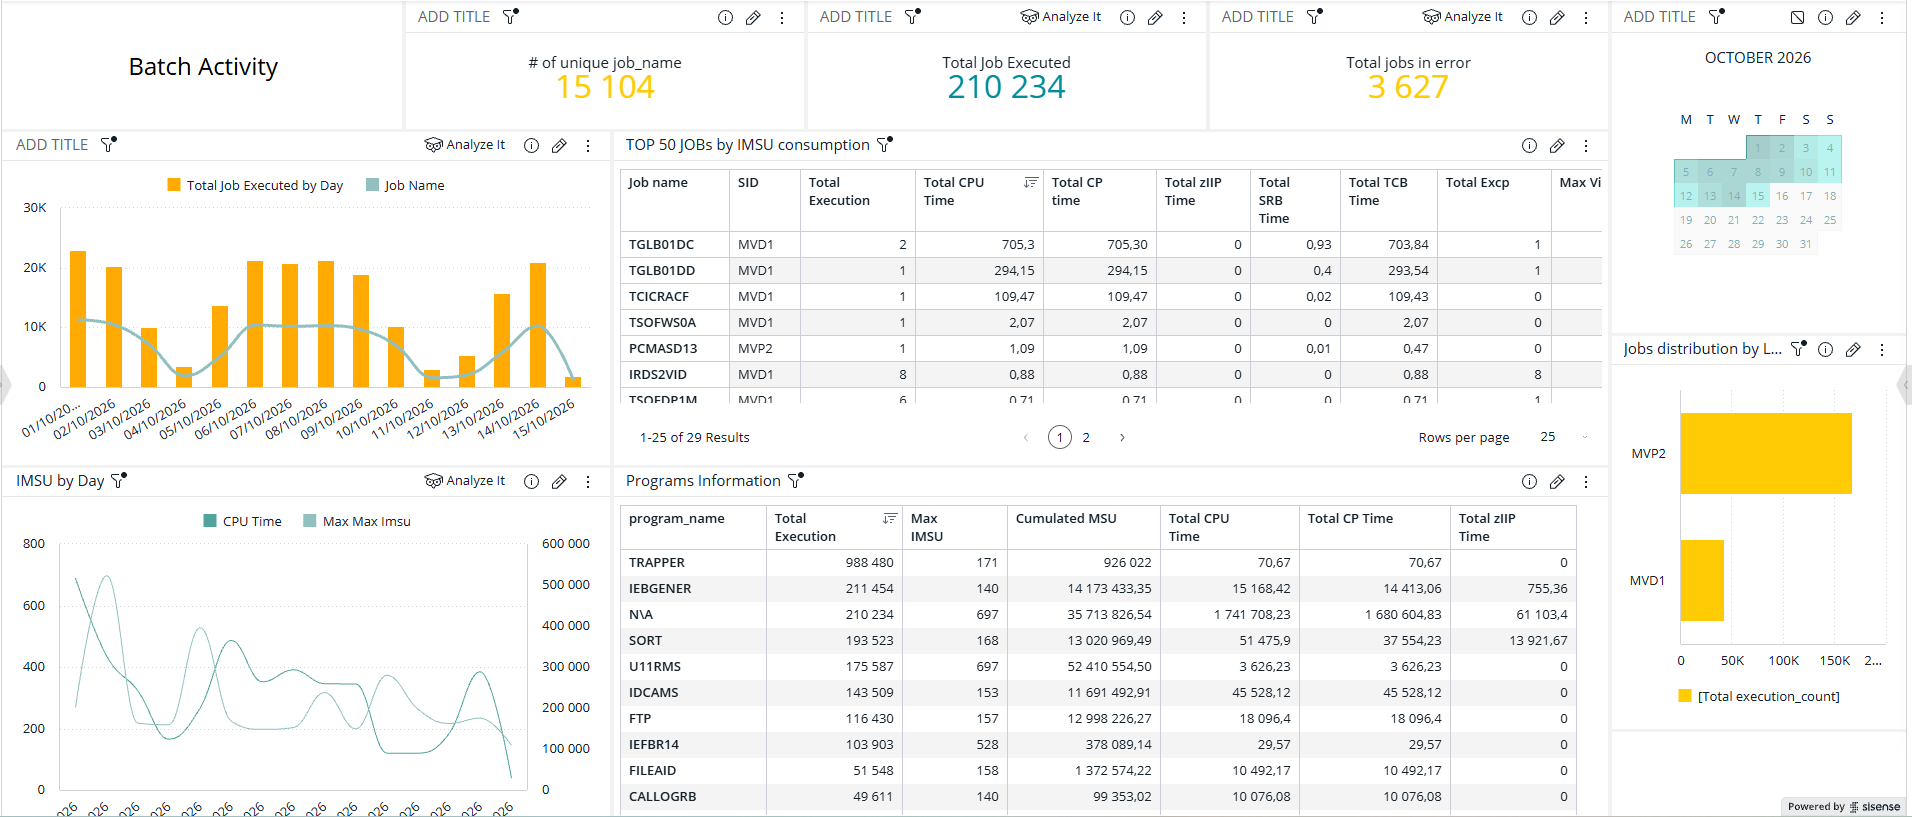
ZSI also covers monitoring views. The batch activity dashboard below shows, for a chosen period, how many jobs ran and how many ended in error. It also shows which jobs and programs consumed the most capacity, so a team sees where batch work spends its resources.
Source: Zetaly Service Intelligence (ZSI), screen from a customer environment.
Dashboards for specific needs take design time. Mainframe customers already have a metrology team whose members can learn to design them, or an integrator can build them. If you don’t have the resources or mainframe expertise in-house, Zetaly’s services team can help you set them up. With the SaaS option, custom dashboards are an additional service.
When a project takes a long time, the time goes into the work around the product. Replacing an older tool can mean loading years of historical data and rebuilding every old dashboard in the new tool, and that integration work sets the timeline.
The most common mistake is to skip training. A team that already knows BI often assumes that it can build dashboards without help, but the BI engine in ZSI stores data in cubes whose time-based structures follow their own rules. Dashboards built without those rules give wrong results or perform poorly, which is why Zetaly offers this training to every customer at the start.
Frequently asked questions
What is an observability dashboard?
An observability dashboard shows the health of an IT system in a form that people can read immediately, because it displays enriched and transformed data instead of raw metrics. From a summary view, users click down to more detailed dashboards until they reach the data behind a problem, so nobody needs to know in advance which screen to open.
What is the difference between a monitoring dashboard and an observability dashboard?
A monitoring dashboard displays raw metrics as they are collected, in real time, over a period of up to one hour. The other kind enriches the data to make it easy to read, and keeps history for comparisons. It also lets users drill down from a summary to the detail. Zetaly customers run both kinds, because they do different jobs.
What is business observability?
Business observability connects technical data to business results. On the mainframe, Zetaly applies it to consumption. To do so, each customer defines its business categories, such as business units or applications. Dashboards then show capacity use by category instead of by technical component. So managers, chief technology officers, and chief financial officers can read the data without a specialist.
Can I view observability data on a single dashboard?
Yes, at a high level. The entry dashboard covers the whole IT system in one view, with green and red indicators. Detailed data then sits in further dashboards that users open with one click. For the mainframe, ZSI also consolidates data from all partitions and entities into one view, so nobody has to assemble it partition by partition.
How often does an observability dashboard refresh?
In Zetaly Service Intelligence, the refresh rate depends on how the dashboard reaches the data. A dashboard built on a data cube refreshes once an hour at most. A dashboard with a live connection to the data refreshes every 30 seconds. Distance matters too, because a hosted platform far from the data center can receive hourly files.
Can an observability dashboard replace debugging tools?
No. The dashboard shows where a problem sits, down to a fairly fine level, but debugging an application needs far more detailed data than Zetaly collects. Teams therefore use the dashboard to find the weak point, then switch to their monitoring and diagnostic tools to find the exact error.
Who builds observability dashboards in ZSI?
Zetaly Service Intelligence (ZSI) comes with pre-built dashboards that work as soon as data collection starts. For specific needs, a trained customer team or an integrator builds the dashboards. If you do not have the resources or the mainframe expertise in-house, Zetaly’s services team is there to help you set them up.