
Mainframe reporting tools that turn operational data into decisions
Give every team a dashboard they can read without a mainframe specialist to translate it.

Your mainframe produces a constant stream of operational data. On its own, it stays technical and scattered, hard to turn into decisions. Zetaly Service Intelligence (ZSI) turns that data into dashboards and reports organized by business domain, so each team sees what matters to it. With built-in business intelligence (BI) capabilities, ZSI delivers dynamic dashboards and analytics, so IT and business teams make smarter, faster decisions. It works with the Zetaly Data Platform (ZDP) and connects to external sources such as databases, data lakes, Excel files, and APIs, so that a single dashboard can bring technical metrics and business context together, across mainframe and hybrid IT.
Make sense of your operational data
Gain full visibility into your mainframe activities.
Understand how the parts of your infrastructure depend on each other.
Connect technical data to its business context.
Automatically detect anomalies or use predefined criteria.
Track the key performance indicators (KPIs) that matter for informed decisions.
Optimize your IT operations for better efficiency.
Support decision-making for both IT and business teams.
Powered by ZDP, open to external data
ZSI runs on data enriched and streamed by ZDP. With ZDP, your mainframe and non-mainframe operational data is automatically collected, enriched, and exposed in real time. In ZSI, you visualize, analyze, and act on it through dashboards and analytics. Together, ZDP and ZSI cover the whole path from data collection to business insight — so you understand how system performance affects your business outcomes, not just your systems. Beyond ZDP, ZSI also brings in external business data: databases, data lakes, Excel files, and APIs. That means you can correlate your mainframe data with any external data source, for a fuller picture than mainframe data alone would give you. During a campaign, for example, you could match transaction volumes against web analytics.
Discover Zetaly Data PlatformConsolidated across all your entities
ZSI consolidates data from all your entities into one view. Legacy IBM tools work one logical partition (LPAR) at a time, so assembling a cross-partition view is laborious. ZSI’s collection architecture groups entities into business segments by default, which makes the per-business-domain dashboards possible.
Pre-built dashboards, and your own
Every business measures itself differently, so ZSI gives you both. You start from pre-built dashboards that cover the common themes and KPIs of an information system, for insight on day one. When you need something more specific, you modify a dashboard, adapt it, or design a new one, from an existing model or from scratch. Building or updating a dashboard means knowing your business and how your systems are organized. If you don't have the resources or mainframe expertise in-house, Zetaly’s services team offers training and custom dashboard development to help you set them up.
Examples of pre-built and customized dashboards in ZSI.
See ZSI in action
Watch the ZSI dashboard in motion: its key performance indicators (KPIs) update in real time, and you see how an issue is spotted and addressed at a glance.
Want to go deeper? Our recorded webinar gives you a full demo of what ZSI can do.
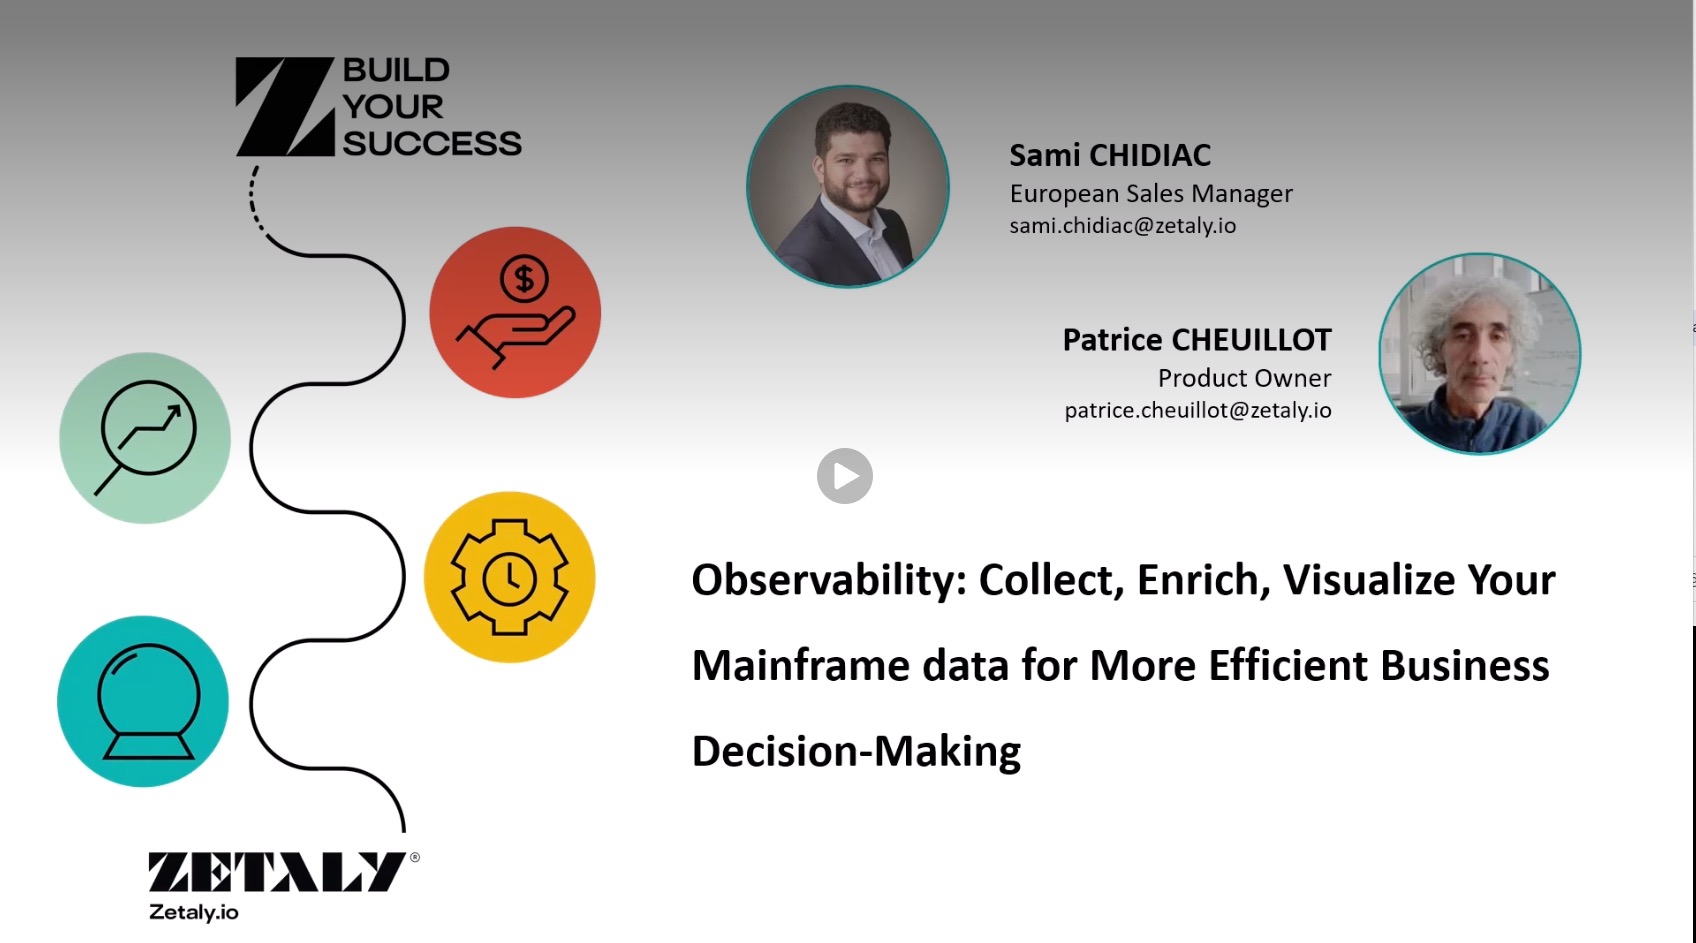
Use case
Dynamic service evaluation
Evaluate the quality of a service by moving from a broad overview dashboard down to a detailed one. That transition lets you filter the data and pinpoint irregular transactions, so you can investigate what is affecting service quality and act on it.
Use case
WLM objective monitoring
Monitor the performance objectives set in the Workload Manager (WLM) and check they are being met, from a single ZSI dashboard.
Deployment, support and services
Deployment
You can run ZDP on-premises in your own environment, so your mainframe data stays within your infrastructure. Or choose the SaaS platform hosted and managed by Zetaly, which handles hosting, maintenance, and availability. The subscription works the same way for both options; only the base price is different.
Compare deployment optionsSupport
Zetaly's in-house experts handle your incidents and tickets through the Zetaly support portal, backed by continually updated product documentation and two named contacts — an Account Executive and an Account Manager — assigned from the start of your engagement.
See Zetaly supportServices
Zetaly’s services teams help you validate and adopt the platform: a proof of value (POV) or proof of concept (POC) before you commit, then installation, upgrades, migration and team training.
Explore Zetaly servicesResources
Whitepaper — 10 ways to increase your mainframe return on investment (ROI).
Download the whitepaperFrequently Asked Questions
What is Zetaly Service Intelligence (ZSI)?
ZSI is an ITOps solution that turns operational data into actionable business insights. It works with the Zetaly Data Platform (ZDP) and also connects to external sources such as databases, data lakes, Excel files and APIs, so that a dashboard can bring technical metrics and business context together across mainframe and hybrid IT.
What data can ZSI use?
ZSI uses the operational data ZDP collects, enriches and exposes, and it also connects to external business sources: databases, data lakes, Excel files and APIs. That lets a single dashboard combine your mainframe metrics with wider business data.
Does ZSI come with pre-built dashboards?
Yes. ZSI ships with a range of pre-built dashboards covering the common themes and key performance indicators of an information system, so you get insight from day one. You can also modify, adapt, or design your own.
Can I build my own dashboards in ZSI?
Yes. Beyond the pre-built dashboards, ZSI lets you modify an existing model, adapt it, or design a new dashboard from scratch, so the analytics match your own goals.
How do ZSI and ZDP work together?
ZDP collects, enriches, and exposes mainframe and non-mainframe operational data in real time; ZSI visualizes, analyses, and acts on it. Together they cover the path from data collection to business insight.
What can ZSI help me do?
ZSI gives you visibility into your mainframe activities, shows how your infrastructure depends on itself, connects technical data to its business context, tracks the KPIs that matter, and supports decisions for both IT and business.