
Observability Dashboards: Transform your IT Operations
In the realm of information technology, the concept of observability has become a pivotal aspect of managing complex systems and ensuring their reliability, performance, and security.
Observability dashboards serve as a critical tool, offering a real-time graphical interface that allows IT professionals to monitor, analyze, and optimize their systems. This blog post will explore the components of an observability dashboard and describe its functionality within an organization's IT ecosystem.
How does an Observability dashboard work?
The operation of an observability dashboard is centered on the continuous collection and analysis of data from across the IT environment. This data is gathered from various sources, including hardware sensors, application performance monitoring tools, log files, and network traffic analyzers. Advanced dashboards leverage artificial intelligence and machine learning algorithms to sift through this data, identifying patterns, anomalies, and trends.
When the system detects an anomaly or a predefined condition is met, it triggers an alert. These alerts are then displayed on the dashboard, along with contextual information to help IT professionals understand the nature and severity of the issue. Users can drill down into detailed views of the data, perform root cause analysis, and take corrective actions directly from the dashboard.
In this regard, Zetaly Service Intelligence provides comprehensive observability dashboards tailored specifically for IT operations, addressing the intricate demands of mainframe environments. By integrating seamlessly with existing infrastructure, Zetaly offers real-time insights into system performance, resource utilization, and transaction flows. This enables IT professionals to proactively monitor their mainframe systems, identifying potential issues before they escalate into critical problems. The dashboard's intuitive interface simplifies the complexity of mainframe data, presenting it in an easily digestible format that enhances decision-making processes. Through customizable widgets and alerts, Zetaly ensures that teams are not only alerted to anomalies but also equipped with the detailed diagnostics necessary to swiftly resolve them. This level of observability is crucial for maintaining the high availability and reliability expected of mainframe operations, making Zetaly a vital tool in the modern IT toolkit.
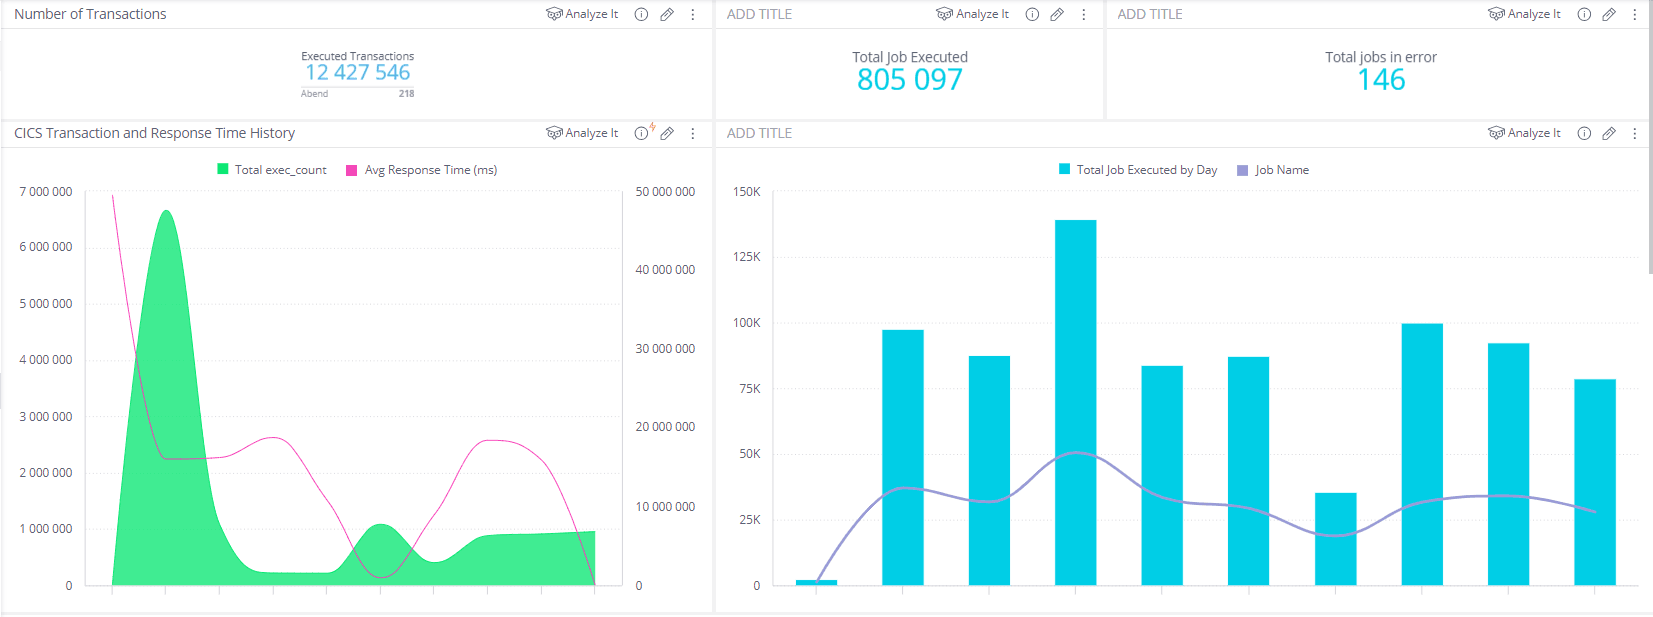
Zetaly Service Intelligence dashboard example
Key Insights from IT Observability Dashboards
- System Health Indicators
One of the primary features of an IT observability dashboard is the display of system health indicators. These include metrics such as CPU usage, memory consumption, disk I/O, network latency, and throughput. By presenting these metrics in an easily digestible format, the dashboard allows IT teams to quickly assess the health of their systems and identify areas that may require attention.
- Service and Application Performance Metrics
Beyond hardware and network statistics, IT observability dashboards also focus on the performance of services and applications. This encompasses response times, error rates, transaction volumes, and user satisfaction scores. These metrics are crucial for understanding the end-user experience and ensuring that applications meet performance expectations.
- Logs and Event Management
Logs and events provide a detailed account of what is happening within the IT infrastructure. An observability dashboard aggregates logs from various sources and presents them in a unified view, enabling IT professionals to search, filter, and analyze log data. Event management features allow users to correlate events across systems, helping to pinpoint the root causes of issues.
- Alerts and Notifications
A proactive observability dashboard is equipped with robust alerting and notification capabilities. It can be configured to trigger alerts based on specific conditions, such as performance thresholds being exceeded or the detection of suspicious activities. These alerts ensure that IT teams can respond promptly to potential issues before they impact business operations.
- Dependency Mapping and Topology Visualization
Understanding the interdependencies between different components of the IT infrastructure is vital. An observability dashboard provides tools for mapping these relationships and visualizing the topology of the network, applications, and services. This feature aids in impact analysis, helping IT professionals understand which components may be affected by a particular issue.
In conclusion, an IT observability dashboard is an indispensable tool in the modern IT landscape, providing a comprehensive view of the health and performance of IT systems. By integrating data from various sources and offering powerful analytical tools, it enables IT teams to maintain optimal system performance, enhance security, and ensure a superior user experience. Through real-time monitoring, alerting, and visualization capabilities, an IT observability dashboard empowers organizations to proactively manage their IT infrastructure and respond swiftly to emerging challenges.