
Enhance IT Production Efficiency with Observability: Which Key Performance Indicators to Track?

For the IT production team, ensuring user satisfaction requires constant effort. IT services play a crucial role in numerous businesses and must always remain operational. However, it's not sufficient to simply maintain accessibility. Users expect quick response times and prompt resolution of any issues they encounter as the smooth operation of IT activities is vital for their business operations. To achieve this, the IT production team must adhere to Service Level Agreements (SLAs) and monitor several key performance indicators.
Why is the challenge bigger than ever? In short, most organizations have hybrid environments: the infrastructure is often made of several types of servers. Windows servers, Linux servers, AS/400, IBM mainframes… The primary objective of these companies revolves around effectively monitoring IT activity, regardless of the location or platform on which the services are running.
However, in large organizations, different teams or departments may be responsible for managing different parts of the infrastructure. Silos can lead to fragmented visibility, with each team having limited knowledge of the broader infrastructure and its interactions.
The very nature of workloads, organizational habits, and production objectives may differ greatly from department to department.
To address these challenges, organizations often employ comprehensive monitoring and management solutions such as the Zetaly Data Platform that can integrate data from various sources, provide visualization tools, and enable centralized monitoring and analytics. Implementing standardized monitoring practices, establishing clear communication channels between teams, and promoting cross-functional collaboration are also essential in obtaining a big picture of complex infrastructures.
Let's say you have now access to the log data from all the parts of your infrastructure. How do you leverage these data to streamline your IT production? Effective log analytics should allow you to answer the following questions.
Question #1 - What are we producing?
Ways to answer this question vary greatly based on the platform considered.
On distributed servers, the nature of the work is physically divided among several hardware components or in virtualization layers. Each service has its own source of log data.
In this case, determining their level of activity depends on your ability to map your business services to activity metrics such as CPU usage, memory usage, or number of requests processed by the applications.
Mainframe production comes with an integrated approach and is often considered to be a "black box". Resources are pooled together to execute two types of work: transactional (TP) and batch processing. The first question the production team must answer is the level of activity in each category.
Online activity is measured by the total number of transactions executed over a specific period. It's important to consider the overall transaction volume, regardless of the OLTP program used (such as CICS or IMS/DC). This volume can also be expressed as transactions per second to gauge activity throughput.

Figure 1. Number of transactions - Zetaly Service Intelligence
For batch activity, the focus is on the number of batch jobs executed within a given timeframe. Batch jobs are scheduled tasks that should not disrupt online activity. Monitoring the volume of batch jobs executed during the TP window is critical.

Figure 2. Number of batch jobs - Zetaly Service Intelligence
To precisely identify the nature of business operations executed on the mainframe, it is essential to tag jobs and transactions based on the company's standardized naming conventions. This enables the tracking of the underlying services associated with the activity.
Understanding IT business profiles is also crucial for improving service quality. Key considerations include identifying the busiest periods within a month, identifying off-peak periods suitable for running batch jobs and determining the busiest days of the week. It's important to note that a business's profile is likely to change over time as the business evolves, so historical data analysis and comparisons are also valuable.
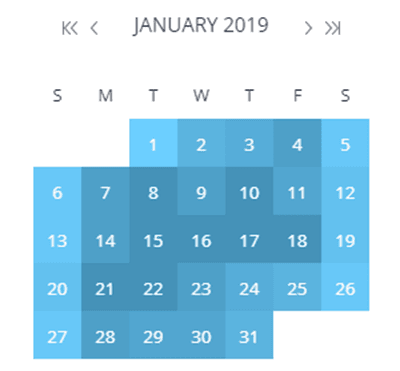
Figure 3. Activity peaks on calendar - Zetaly Service Intelligence
Question #2 - Which resources are involved?
Each task executed consumes resources in varying proportions. A high-level approach to resource monitoring focuses on CPU consumption and storage usage.
Processors are among the most valuable resources in IT production. It's crucial to ensure their computing power is allocated to the appropriate activities. Monitoring total CPU time effectively achieves this and helps detect any excessive consumption resulting from program loops.
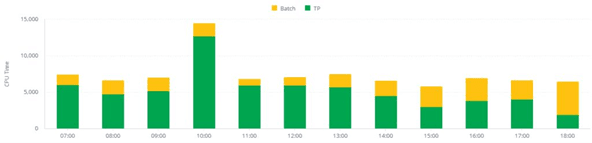
Figure 4. Evolution of batch and TP activity during the day - Zetaly Service Intelligence
Regarding storage, the priority is to determine the availability of free space. Additionally, it's essential to monitor activity density within critical storage groups to identify potential bottlenecks caused by improper distribution.
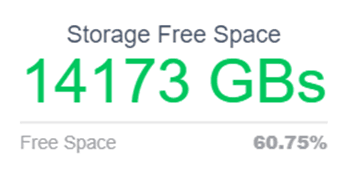
Figure 5. Storage free space KPI - Zetaly Service Intelligence
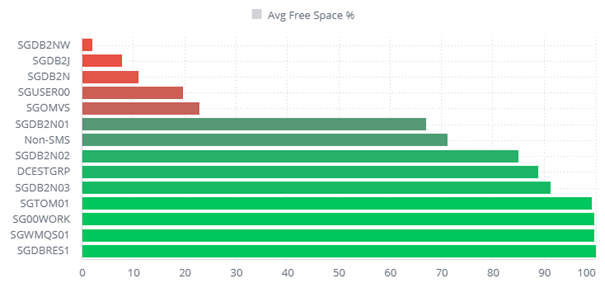
Figure 6. Storage group monitoring per % of free space available - Zetaly Service Intelligence
Question #3 - What is the quality
The availability of services for users is the primary indicator of quality. Distributed servers must be up and running when business users need to access them. On the mainframe side, it involves ensuring that OLTP servers are accessible during business hours and that batch jobs are completed for uninterrupted business continuity. Monitoring critical paths helps ensure the readiness of TP operations for resumption.
Response times for various applications serve as another quality indicator. Lengthy wait times for answers or job completion are undesirable for users. Maintaining good response times is crucial for customer satisfaction. Average response times for online activity provide a starting point and help identify deviations. For deeper insights, monitoring response times at the business application level is recommended to identify specific users experiencing poor response times.
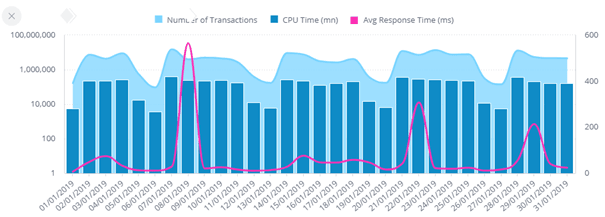
Figure 7. Volume of transactions vs. response time - Zetaly Service Intelligence
In mainframe environments, analyzing the Workload Manager (WLM) is valuable for understanding service quality. This z/OS component provides performance indexes for each service class, indicating whether performance goals are being met. An index greater than 1 signifies lower-than-expected service quality.
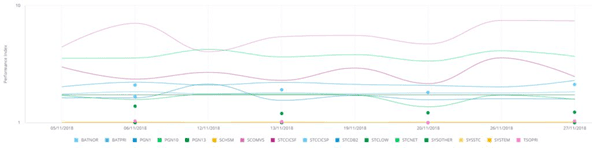
Figure 8. Performance index evolution - Zetaly Service Intelligence
The Mean Time To Repair (MTTR), specified in the SLAs, should also be tracked. Access to appropriate data for investigation facilitates the reduction of MTTR.
Question #4 - What are the associated costs?
In the distributed world, costs are often easier to follow as each new server has a specific and known cost. The same can be applied to additional memory, processors, storage devices… Software costs are usually part of enterprise contracts that ease budget tracking. However, in mainframe environments, costs can be a tricky thing to follow.
Software accounts for nearly 50% of mainframe costs. Many IBM software products are invoiced monthly based on the peak Million Service Units (MSUs) consumed. Monitoring MSU consumption is essential for controlling mainframe costs. Since this consumption peak is calculated for each LPAR (Logical Partition), focusing on MSU levels at this scope is recommended. However, it's important to identify the specific contributors to billing for cost-reduction initiatives.
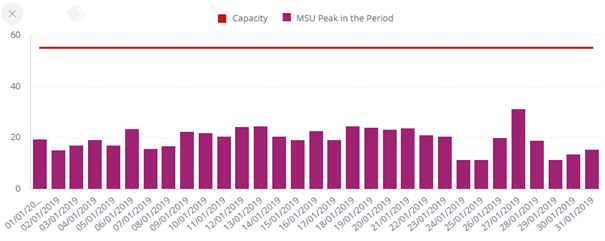
Figure 9. MSU peak per day vs. total capacity - Zetaly Service Intelligence
Costs are not limited to software expenses. Hardware investments, human resources, and services also contribute to the overall budget. Tracking costs versus the budget for each expenditure item provides valuable insights for effective cost control.
To summarize, the IT team needs to monitor IT production daily to ensure optimal performance, detect and troubleshoot issues promptly, and facilitate effective capacity planning. By monitoring systems, networks, and applications, they can identify performance bottlenecks, proactively address potential problems, and optimize resource utilization. Real-time monitoring allows for quick detection of issues and enables timely troubleshooting, minimizing downtime and ensuring uninterrupted business operations. Additionally, monitoring helps the team assess capacity requirements and scalability needs, ensuring that IT infrastructure can meet the demands of the organization.